If you have read KPI Paradigm Shifts of PuMP articles #1 and #2, skip this intro and scroll down to today’s article. If you haven’t, here is the link that introduces our 5-part blog series, inspired by the Paper published by the United Nations Economic Commission for Europe, about how they used PuMP to measure the value of official statistics and the paradigm shifts they experienced. (Full series context here)
Do your measurement conversations start like this?
“This goal needs a measure (i.e. KPI, indicator, metric). What data do we have?
This question is an all-too-common approach to performance measurement, and it drives people to start looking at the data they have available first, and then decide what they can measure using that data.
This approach is backwards if what we want for our organizations are better measures.
We can’t let our existing data decide what we should measure. Strategy is about change for a better future, and measuring these important improvement areas will often require new or different data than we already have.
How can we move backward conversations forward so we can produce great measures and useful insights?
First, we have to make our strategic goals more measurable by writing them as performance results that state the impact we want to achieve.
Once we have articulated what we want to achieve (our performance result), we can move to a measure design conversation using these questions to shift our thinking:
- What evidence of our result occurring could we detect in the real world that would convince us we are improving?
- What is the most meaningful way to quantify this evidence (ie. statistics such as percentages, averages, ratios, counts)?
- Of these potential measures (each designed from different evidence), which would:
- Tell us the strongest story that would prove that performance was improving or not?
- Be most feasible – the easiest or hardest to get the data we would need?
- Have unintended consequences we want to avoid?
Based on this “potential measure” conversation within the measure design process, we can select the 1-2 strongest and most feasible measures to take a deeper dive into. Our conversation about the data can now be more specific about how and where to access it.
If we keep limiting what we measure by the data we have easily available, we will never have the data we really need to give us feedback on the goals that matter most.
Wondering if your organization is stuck in rushing to data to find your measures?
Look for these symptoms…
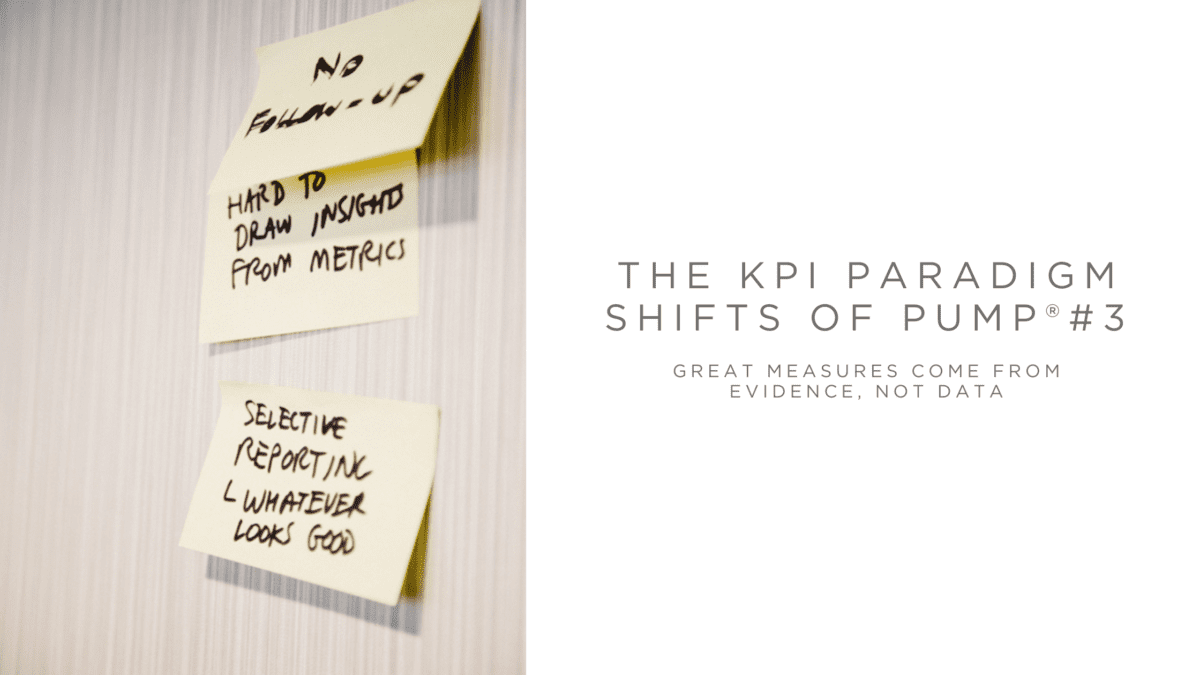
The symptoms that our organization has not yet made this paradigm shift, and is still stuck in letting data decide what to measure, often sound like this….
Symptom #1: Teams rush to ready-made measures, inadvertently distracting people.
You will recognize this symptom in the workplace when people rely on ready-made measures from analytics tools (for example, Microsoft’s Workplace Analytics or Google’s Search Console) as their sources of strategic measures.
These ready-made measures can be deceptively appealing. Let’s unpack that.
- Appealing: measurement now seems as easy as clicking a few buttons; and, the fact that someone else outside your organization has done the hard work and set up the data capture systems is what creates their magnetic appeal.
- Deceptively: but how well do these external people who set up these ready-made measures know your organization and what matters most? Will they truly produce evidence for your unique organization’s goals?
Symptom #2: People rely on traditional measures that have always been used.
You will recognize this symptom in the workplace when people find it hard to let existing measures go, especially when there’s nothing better to replace them. As a result, many measures that were important in the past stay in the spotlight (and in reports) long after their relevance has disappeared.
When leaders and teams choose to limit themselves with these outdated measures rather than designing something more meaningful, they are limiting their insights and making it virtually impossible to make evidence-based decisions.
Symptom #3: Your performance dashboards have lots of KPIs, but few of them seem to relate to the goals or objectives they are supposed to be measuring.
You will recognize this symptom in the workplace when leaders are demanding a “dashboard” to fill an information void. In response, the dashboard vendor or reporting team search through existing data sets that the dashboard tool can automatically and easily access. Or they turn the dashboard into an “action-tracking” tool that outlines how projects are progressing, but no information on whether they are having the intended impact.
Either way, leaders have unfortunately created a whirlwind of activity that produces little value for decision-makers because these KPIs and measures don’t align to the strategic goals that the executives are attempting to improve and achieve.
If these same leaders want more value from their measures and reports (eg. better information and insights), they need to:
- Demand statistically-sound evidence of their strategic results, not a dashboard tool.
- Understand that measurement uses data within formulas to produce insights (evidence) about a strategic result improving over time. Data alone is not a performance measure.
Ready to shift the paradigm from using data as measures to using evidence?
Use these Questions to Trigger Conversations and Inspire Change
Question #1: How often do we use the measures we already have for decision making?
- How many measures do we never use or simply ignore?
- How many measures lead us in a circular debate, and we don’t make any decisions about how to improve performance?
- How many measures do the reverse of what we want them to do, and instead distract the conversation away from the performance gaps we want to close?
Question #2: Are we reporting on measures that produce insights, or are we simply discussing data?
- Can we name the measures in our reports that produce the most meaningful insights and why they are so meaningful to us?
- Can we explain why data is not a performance measure, but how they are connected?
Question #3: How much time and money are being spent reporting on data we don’t use or don’t value?
- Have we calculated how much time is being wasted? Here’s how and it is an excellent step to inspire the shift in your organization:
- Estimate how many people are involved in designing measures and reporting performance data.
- Estimate how many person-hours per month they spend doing that, on average.
- Estimate their average hourly wage.
- Estimate the percentage of what gets reported that never, or almost never, gets used to make decisions and take actions from.
- Multiply together and you have the cost of measures that aren’t generating any value.
The waste may shock you.
We did this exercise with one PuMP client, for just one department, and the cost was almost half a million dollars, every single year!
__________________
Did you miss the previous blogs in this series?
- Get the Series full Context
- KPI Paradigm shift #1: Use Measures to improve and learn, not to judge and blame.
- KPI Paradigm Shift #2: Use Measures to monitor our impact, not our activity.
- KPI Paradigm Shift #4: Team alignment to strategy comes from cause and effect thinking, not “mini-me” copy and paste.

