Want your team to remember your Strategic Plan? Have them draw it!
When executing a strategic plan, leaders universally complain of the lack of early adoption. Leaders thought it might be the size of the strategic plan, so the “one page strategic plan” emerged. Leaders summarized that if there is less information to read, employees will be more likely to remember and apply it.
But research shows there is a much more effective way to get your employees to remember important things such as a strategic plan.
This year, Jeffrey Wammes of the University of Waterloo wanted to discover the most reliable way to enhance memory. The project involved a large group of students given a list of words.
“We pitted drawing against a number of other known encoding strategies, but drawing always came out on top,” said the study’s lead author, Jeffrey Wammes, PhD candidate in the Department of Psychology. “We believe that the benefit arises because drawing helps to create a more cohesive memory trace that better integrates visual, motor and semantic information.”
So you might ask: “How do we draw our strategic plan?”
The answer: Draw your strategic plan with a Results Map.
Strategic Plan Visualization: How to draw your strategic plan
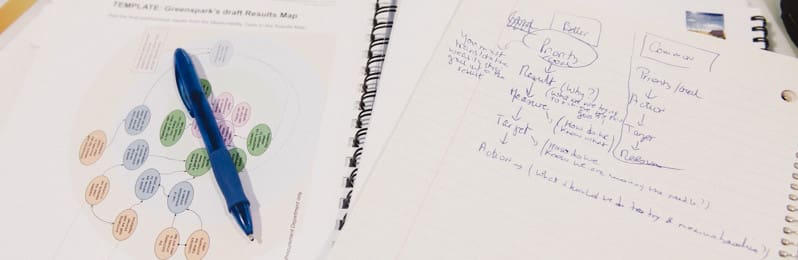
To draw your strategic plan, the leadership team works together to develop a Results Map following the PuMP® Blueprint [fusion_builder_container hundred_percent=”yes” overflow=”visible”][fusion_builder_row][fusion_builder_column type=”1_1″ background_position=”left top” background_color=”” border_size=”” border_color=”” border_style=”solid” spacing=”yes” background_image=”” background_repeat=”no-repeat” padding=”” margin_top=”0px” margin_bottom=”0px” class=”” id=”” animation_type=”” animation_speed=”0.3″ animation_direction=”left” hide_on_mobile=”no” center_content=”no” min_height=”none”][LW1] process.
- First you need to translate your wordy goals into specific result statements (statements that are written in specific, plain language and represent what the organization wants to achieve, not just improve or do) and place each result in a visual “bubble”. Use these questions below to guide your teams conversation:
- Is our goal written as a result (what you want to achieve) or as an action (what you want to improve or do)? If it is written as an action, ask each other “why do we want to do this action?” This question helps lead you to the result.
- Is our goal filled with words that cause more confusion than provide clarity – words like efficient, sustainable, world-class, engagement? If there are words like this in your goal, use plain language a fifth grader could understand instead. This question helps you to be more specific.
- Does our goal have more than one main focus to it? If your goal includes the word “and” then it might include two things you want to accomplish. Separate the two ideas into two different results statements. This question allows you to provide more focus.
- Second, draw the relationships: As the results “bubbles” are placed on the visual map, the team discusses how these strategic plan results are related to each other. There are three important relationship types on a Results Map:
- Cause-effect, which means that by achieving one result, the other is more likely to be achieved
- Companion, which means that both results are synergistic and need to be achieved together
- Conflict, which means that achieving one result puts the other result at a high risk of being sabotaged
- Third, establish a clear line of sight for employees: Strategic plans are rarely linear, so the visual Results Map allows leaders to tell the full inter-related story of how to execute on your organization’s strategic plan. The coloured “zones” of a Results Map are arranged in a way that you can see how your plan (now written as results) cascades outwards from the centre, and the whole map allows people to trace a clear line of sight from their work through to the organization’s purpose. There are almost always four zones in a Results Map:
- The pink zone is the centre “target” zone. It’s where you place results implied by your mission (core purpose) and vision (future you want to achieve).
- The green zone is the next level out, and it’s where you place the results implied by your corporate level goals in your strategic plan
- The blue zone is where you place results that need to be achieved through departmental or customer-facing business processes
- The orange zone is where you place results that need to be achieved by teams, business units or sub-processes.
You can tell the story from the centre pink zone out, but asking the question “How are we going to deliver on our mission?” and trace the story out to the orange zone. You can also tell the story by asking, “Why do we want to make our purchasing process fast and easy?” (a result in your orange zone) and trace the story to the centre pink zone. Employees can then easily see where we can have an impact.
In my experience with clients, this process of taking a written document and turning it into a visual map always invigorates them to execute the strategic plan’s priorities like never before! They say the visual image sticks in their minds and allows for easier and more meaningful recall than the written document alone.
Question: What other techniques have you tried to get teams to remember your strategic plan? Share your thoughts in the comments below.
Related articles:
- What is strategy mapping? And how is it different from results mapping?
- When Planning meeting PuMP®: 4 tips to elevate your strategic planning
The Results Map is a tool created by Australia’s performance expert Stacey Barr and this map is part of an 8-step process called the PuMP® Performance Measure Blueprint. Louise Watson of Adura Strategy is Canada’s Official Partner and Licensed PuMP® Blueprint consultant.
[/fusion_builder_column][/fusion_builder_row][/fusion_builder_container]

