
Do you struggle to get the right measures on your KPI dashboard? Well, you are not alone. One of the most frequent questions I hear is “How do I build a KPI dashboard that people will use?”
First, let’s start with the end in mind. KPI dashboards are worth the time and money it takes to build them when leaders use their measures to easily identify areas of improvement and make decisions on how to close those performance gaps.
The bad habit that is often behind leaders not finding their current KPI dashboard useful is that people rush to build the dashboard and neglect the critical steps needed to ensure they select the “right” metrics.
Follow these 3 steps to build better KPI dashboards for your organization:
Step 1: Align your performance measures to your corporate goals
There are so many things that an organization could measure, but your KPI dashboard needs to focus on what the organization should measure. So start with your corporate strategy. What does your strategic plan say are your priorities?
However, strategic plans often have goals that are written in corporate jargon, fuzzy language and vague ideals that cause another common struggle: the people who are asked to develop performance measures have to guess or assume what words like effective, sustainable, world-class and innovation really mean. If your organization’s plan suffers from this habit of using fuzzy language or weasel words, then, to get a useful dashboard you must first K.I.S.S. your goals, (Keep it simple stupid). Once you are clear on what your organization is trying to achieve (not just do or improve), then you are on your way to a more meaningful dashboard.
Step 2: Select the strongest and most feasible measures
Now that you clearly understand your organization’s corporate priorities, you can take on the question “What are we going to measure?” It is common for a group of people to get in a room and brainstorm possible measures. Unfortunately, brainstorming is not the right tool to use to have a conversation about which performance measure will be most meaningful on your KPI dashboard. Instead, brainstorming usually produces a volume of ideas from project milestones, to vague measure names, to existing legacy measures.
What you need instead is to have a conversation about what is the direct evidence you would observe when you are achieving your corporate goal. What would you see, hear, or feel if your goals were being achieved?
Then you need to quantify that evidence because all performance measures must be quantified in some way so the data can be compared overtime and to target. Once, you have come up with potential measures, then you can ask, “of these potential measures, which would be the strongest and most feasible to implement?”
Step 3: Design KPI dashboards to answer these critical questions
Dashboards form an integral part of reporting, and the purpose of providing performance reports is to help your audience find answers quickly and easily to these critical questions:
- Where is performance moving toward target?
- Where is performance moving away from target
- Why is performance moving away from target?
- What do you recommend we do now?
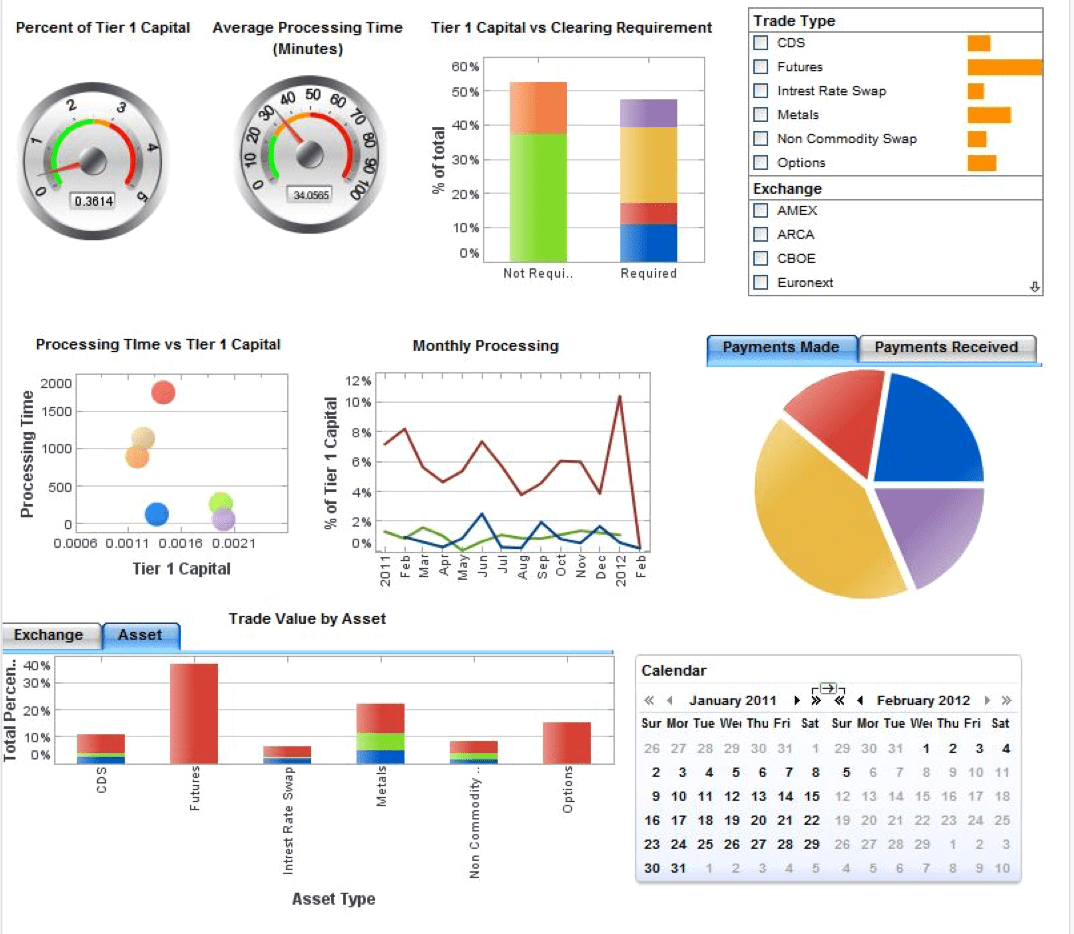
Be aware that many common approaches to charting performance data on KPI dashboards actually cloud the answers and make people look at their data all wrong. (see below example of a KPI dashboard that doesn’t answer the 3 critical questions quickly and easily)
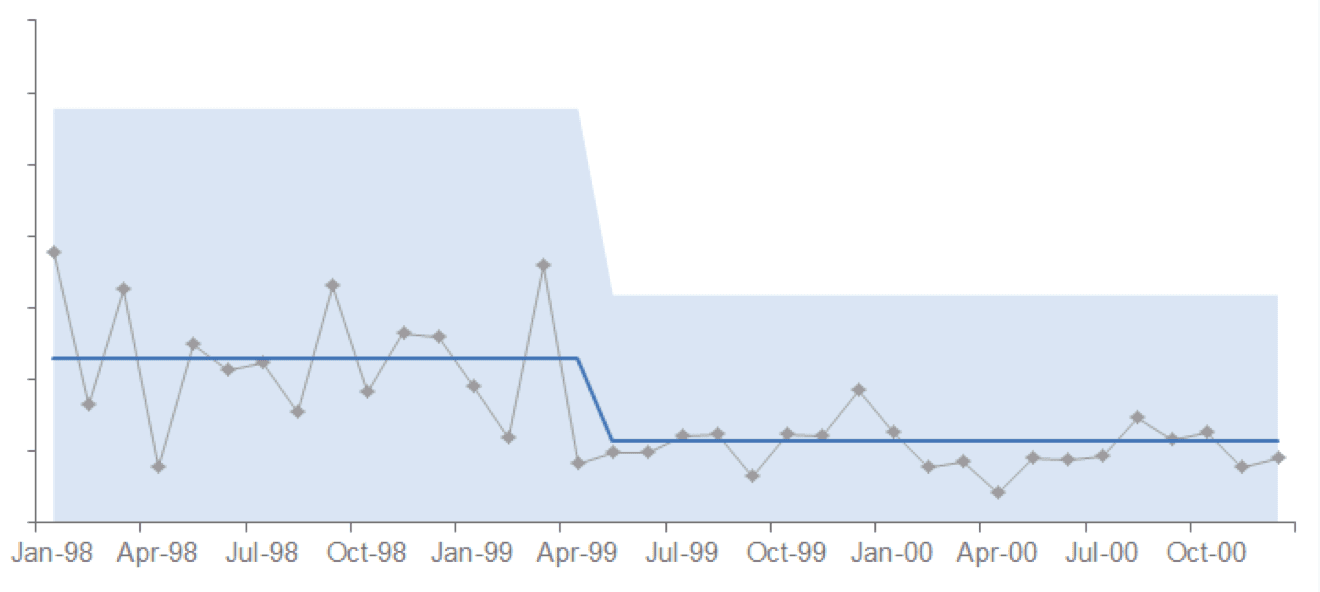
The most powerful chart that helps your audience see what the measures are trying to tell them is the XmR chart. If you want to learn how to get beyond limited comparisons, read about the XmR chart in Donald Wheeler’s fabulous book “Understanding Variation: the key to managing chaos” or listen to PuMP® Blueprint creator Stacey Barr’s interview with Donald Wheeler. (See Example of an XmR chart that helps you quickly and easily answer the question “What is performance doing?)
Is it time you took action? Take stock of your performance reports and dashboards and ask people in your organization how well they answer the critical questions stated above. Here is a suggestion for a micro-action to help you shift from measuring what you can to what you need!
Do you want to overcome your performance measurement struggles?
Click here to download the Whitepaper Measure what Matters and discover more about the 8-step performance measure process called The PuMP® Blueprint.
The PuMP® Performance Measure Blueprint was created by Australia’s performance measure specialist Stacey Barr. Louise Watson of Adura Strategy is Canada’s Official Partner and Licensed PuMP® Blueprint consultant.


